1
2
3
4
5
6
7
8
9
10
11
12
13
14
15
16
17
18
19
20
21
22
23
24
25
26
27
28
29
30
31
32
33
34
35
36
37
38
39
40
41
42
43
44
45
46
47
48
49
50
51
52
53
54
55
56
57
58
59
60
61
62
63
64
65
66
67
68
69
70
71
72
73
74
75
76
77
78
79
80
81
82
83
84
85
86
87
88
89
90
91
92
93
94
95
96
97
98
99
100
101
102
103
104
105
106
107
108
109
110
111
112
113
114
115
116
117
118
119
120
121
122
123
124
125
126
127
128
129
130
131
132
133
134
135
136
137
138
139
140
141
142
143
144
145
146
147
148
149
150
151
152
153
|
import pandas as pd
import numpy as np
import matplotlib
from matplotlib import pyplot as plt
from matplotlib import lines as mlines
import operator
import time
start = time.time()
pd.set_option('display.max_columns', None)
pd.set_option('display.max_rows', None)
def file_matrix(filepath):
dt = pd.read_csv(filepath)
date_mat = np.zeros((dt.shape[0], 3))
class_label_vec = []
col_val = list(dt)
for i in col_val[:3]:
ind = col_val.index(i)
date_mat[:, ind] = dt[i]
for row in dt.itertuples():
att = getattr(row, 'Attitude')
if att == "didntLike":
class_label_vec.append(1)
elif att == "smallDoses":
class_label_vec.append(2)
elif att == "largeDoses":
class_label_vec.append(3)
return date_mat, class_label_vec
def visualize(date_mat, class_label_vec):
font = {"family" : "MicroSoft YaHei",
"weight" : 6,
"size" : 6}
matplotlib.rc("font", **font)
fig, axs = plt.subplots(nrows=2, ncols=2,sharex=False, sharey=False, figsize=(13,8), dpi=300)
colors_lab = []
for i in class_label_vec:
if i == 1:
colors_lab.append("black")
elif i == 2:
colors_lab.append("orange")
elif i == 3:
colors_lab.append("red")
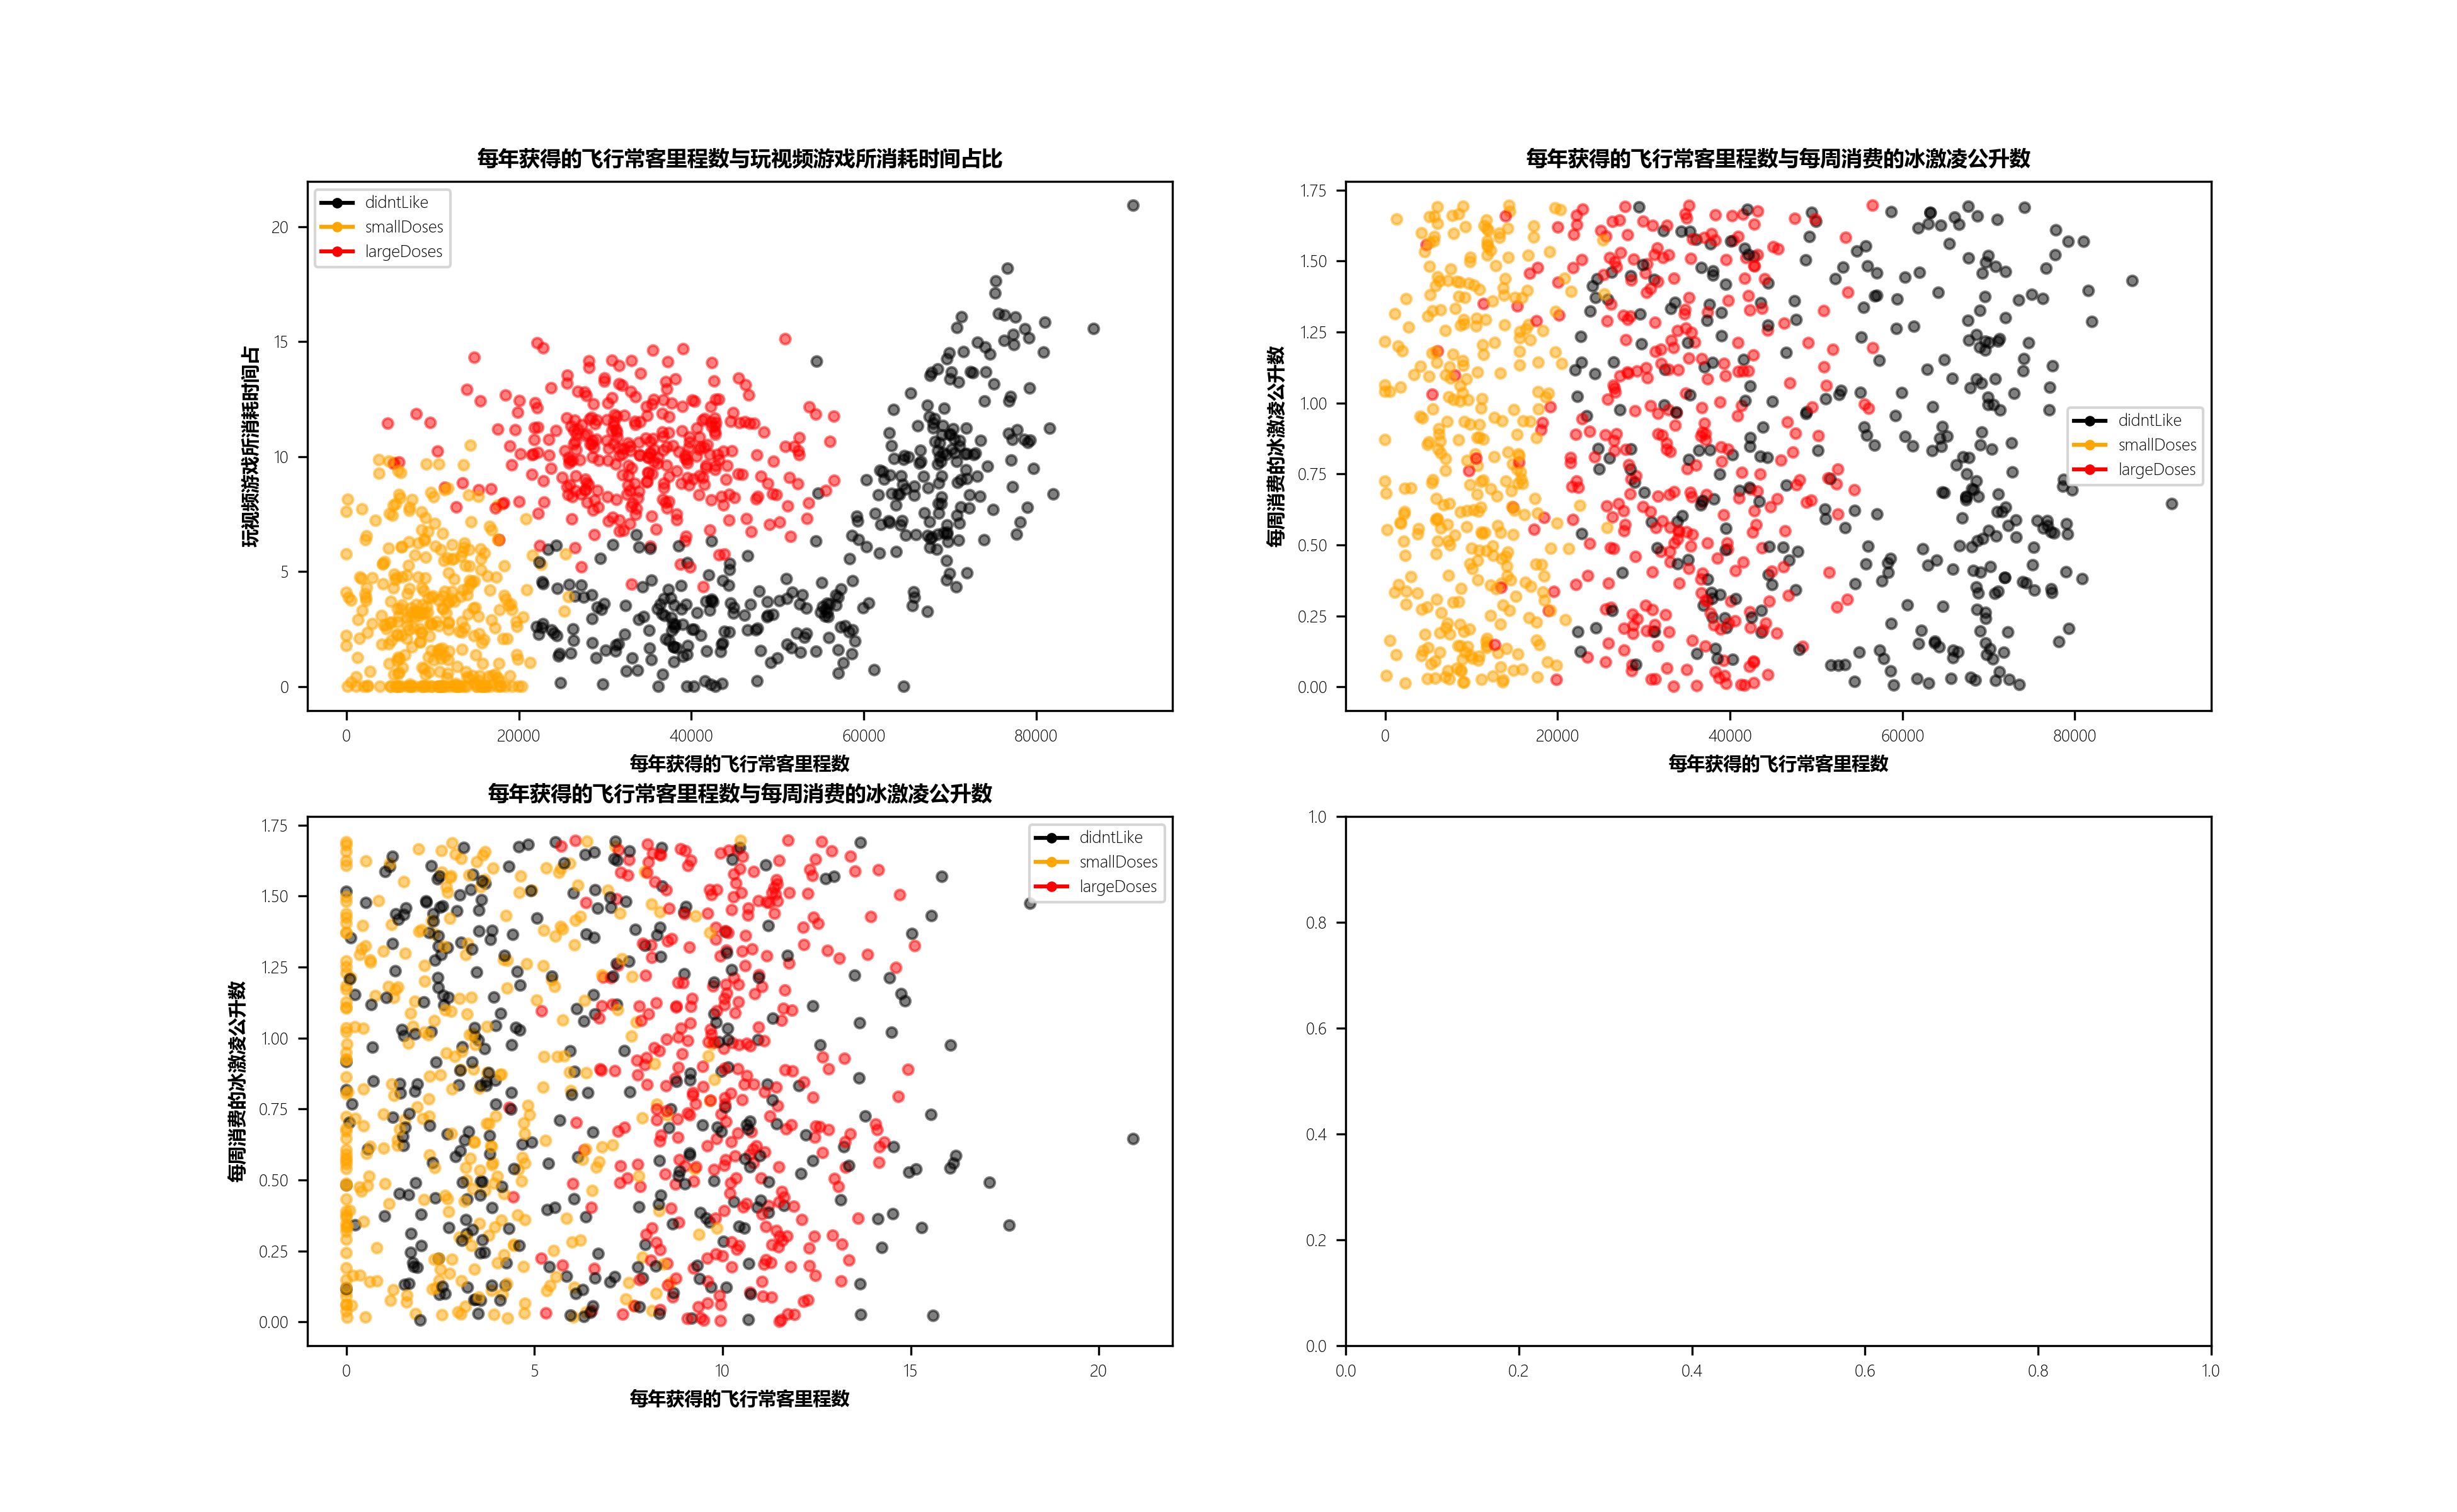
axs[0][0].scatter(x=date_mat[:, 0], y=date_mat[:, 1], color=colors_lab, s=15, alpha=.5)
axs0_title = axs[0][0].set_title("每年获得的飞行常客里程数与玩视频游戏所消耗时间占比")
axs0_xlabel = axs[0][0].set_xlabel("每年获得的飞行常客里程数")
axs0_ylabel = axs[0][0].set_ylabel("玩视频游戏所消耗时间占")
plt.setp(axs0_title, size=8, weight="bold", color="black")
plt.setp(axs0_xlabel, size=7, weight="bold", color="black")
plt.setp(axs0_ylabel, size=7, weight="bold", color="black")
axs[0][1].scatter(x=date_mat[:, 0], y=date_mat[:, 2], color=colors_lab, s=15, alpha=.5)
axs1_title = axs[0][1].set_title("每年获得的飞行常客里程数与每周消费的冰激凌公升数")
axs1_xlabel = axs[0][1].set_xlabel("每年获得的飞行常客里程数")
axs1_ylabel = axs[0][1].set_ylabel("每周消费的冰激凌公升数")
plt.setp(axs1_title, size=8, weight="bold", color="black")
plt.setp(axs1_xlabel, size=7, weight="bold", color="black")
plt.setp(axs1_ylabel, size=7, weight="bold", color="black")
axs[1][0].scatter(x=date_mat[:, 1], y=date_mat[:, 2], color=colors_lab, s=15, alpha=.5)
axs2_title = axs[1][0].set_title("每年获得的飞行常客里程数与每周消费的冰激凌公升数")
axs2_xlabel = axs[1][0].set_xlabel("每年获得的飞行常客里程数")
axs2_ylabel = axs[1][0].set_ylabel("每周消费的冰激凌公升数")
plt.setp(axs2_title, size=8, weight="bold", color="black")
plt.setp(axs2_xlabel, size=7, weight="bold", color="black")
plt.setp(axs2_ylabel, size=7, weight="bold", color="black")
didntLike = mlines.Line2D([], [], color='black', marker='.', markersize=6, label='didntLike')
smallDoses = mlines.Line2D([], [], color='orange', marker='.', markersize=6, label='smallDoses')
largeDoses = mlines.Line2D([], [], color='red', marker='.', markersize=6, label='largeDoses')
axs[0][0].legend(handles=[didntLike, smallDoses, largeDoses])
axs[0][1].legend(handles=[didntLike, smallDoses, largeDoses])
axs[1][0].legend(handles=[didntLike, smallDoses, largeDoses])
plt.show()
def auto_norm(date_mat):
min_vals = date_mat.min(0)
max_vals = date_mat.max(0)
ranges = max_vals - min_vals
norm_data = np.zeros(np.shape(date_mat))
l = date_mat.shape[0]
norm_data = date_mat - np.tile(min_vals, (l, 1))
norm_data = norm_data / np.tile(ranges, (l, 1))
return norm_data
def classify(inX, dataset, labels, k):
dataset_size = dataset.shape[0]
diff_mat = np.tile(inX, (dataset_size, 1)) - dataset
sq_diff_mat = diff_mat ** 2
sq_distances = sq_diff_mat.sum(1)
distances = sq_distances ** 0.5
sorted_distances = distances.argsort()
class_count = {}
for i in range(k):
votelabel = labels[sorted_distances[i]]
class_count[votelabel] = class_count.get(votelabel, 0) + 1
sorted_class_count = sorted(class_count.items(), key=operator.itemgetter(1), reverse=True)
return sorted_class_count[0][0]
def test(filepath):
date_mat, class_label_vec = file_matrix(filepath)
ratio = 0.10
norm_mat = auto_norm(date_mat)
m = norm_mat.shape[0]
num_test_vecs = int(m * ratio)
error_count = 0.0
for i in range(num_test_vecs):
classifier_result = classify(
norm_mat[i, :],
norm_mat[num_test_vecs:, :],
class_label_vec[num_test_vecs:],
7
)
print("分类结果:%d\t真实类别:%d" % (classifier_result, class_label_vec[i]))
if classifier_result != class_label_vec[i]:
error_count += 1.0
print("正确率:%f%%" % ((1.00 - error_count / float(num_test_vecs)) * 100))
if __name__ == '__main__':
filepath = r"C:\Users\ASUS\Desktop\datingKNN\datingTestSet.csv"
test(filepath)
print("\n")
end = time.time()
print("程序运行时间为:", end-start, "秒")
|


